Authors: Stuart Krause PhD, Colby Griffiths FIT, Lindsay Bunn RFT, and Kyle Broome RPF
Enhanced Wildfire Modeling in the 100 Mile House Regional District
Overview
Wildfire patterns in British Columbia continue to evolve, with changing ignition trends, longer fire seasons, and increasing variability in fire behaviour. In response, Cabin Resource Management has developed an Enhanced Wildfire Modeling (EWM) approach that combines simulation-based modeling, high-resolution remote sensing, and local field data into a practical and scalable decision-making framework.
Burn Probability and Firesheds
Our work in the 100 Mile House Natural Resource District demonstrates how this enhanced framework delivers a more detailed and operationally relevant understanding of wildfire risk. We began by developing ignition prediction models using machine learning to estimate the likelihood of fire starts from both human and lightning causes. These ignition surfaces, along with inputs such as fire weather conditions, fuel types, elevation, and terrain, were used within the Burn-P3 simulation platform (Parisien et al. 2019) to model (e.g., Cell2Fire) how fires are likely to spread across the landscape under different scenarios.
The results include a burn probability surface, which shows how often a given location is likely to burn based on thousands of simulated fire events. This helps identify areas of consistently high exposure over time. We also produced firesheds, which represent the combined areas burned by all simulated fires that reach a specific Area-of-Interest. Firesheds provide a practical way to understand where fire is most likely to originate and how it may affect communities, infrastructure, and ecological resources. Together, these outputs form a foundation for planning and prioritization across a wide range of wildfire mitigation strategies (see Figure 1).
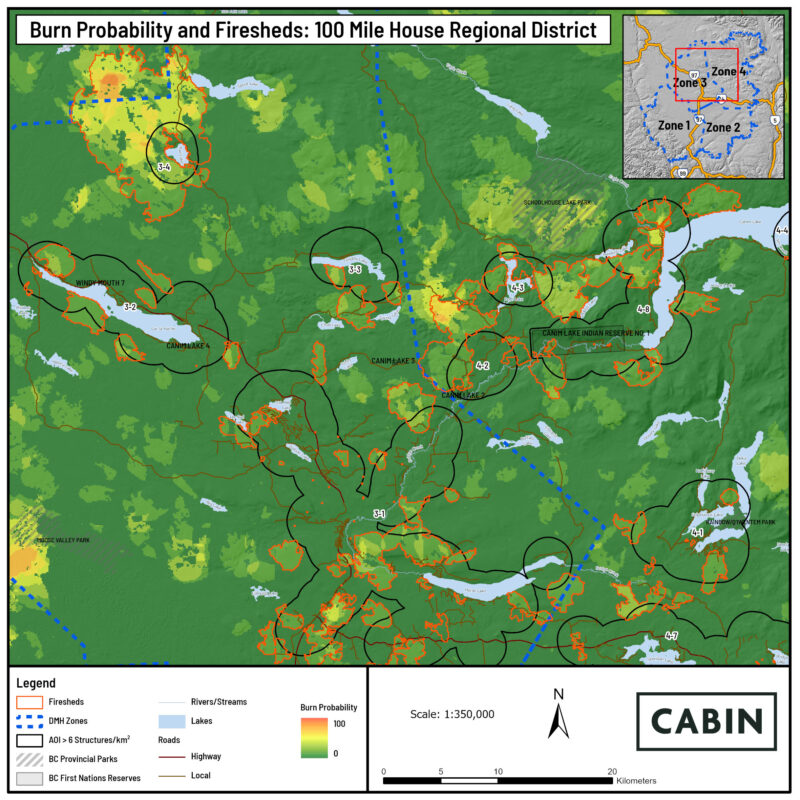
Figure 1: An example of how Burn Probability and Firesheds can be used to visualize areas of consistent wildfire exposure and identify where fires are most likely to originate and spread toward values of interest.
Fine-Scale Hazardous Fuel Mapping
Although burn probability and firesheds offer valuable insights into where fire is most likely to occur and spread, they cannot be relied on alone. To fully understand wildfire risk, it is essential to incorporate current, fine-scale information on hazardous fuels along with local knowledge of vegetation conditions and fire history.
To address this, we developed a custom hazardous fuels map for the 100 Mile region using vegetation and texture indices derived from recent Sentinel-2 satellite imagery (see Figure 2). By applying machine learning classification techniques, we were able to identify areas of elevated fuel hazard at a much finer resolution than the existing provincial fuel type layer. This classification is then validated through targeted ground truthing by field crews, along with UAV imagery collected from key locations identified during the analysis.
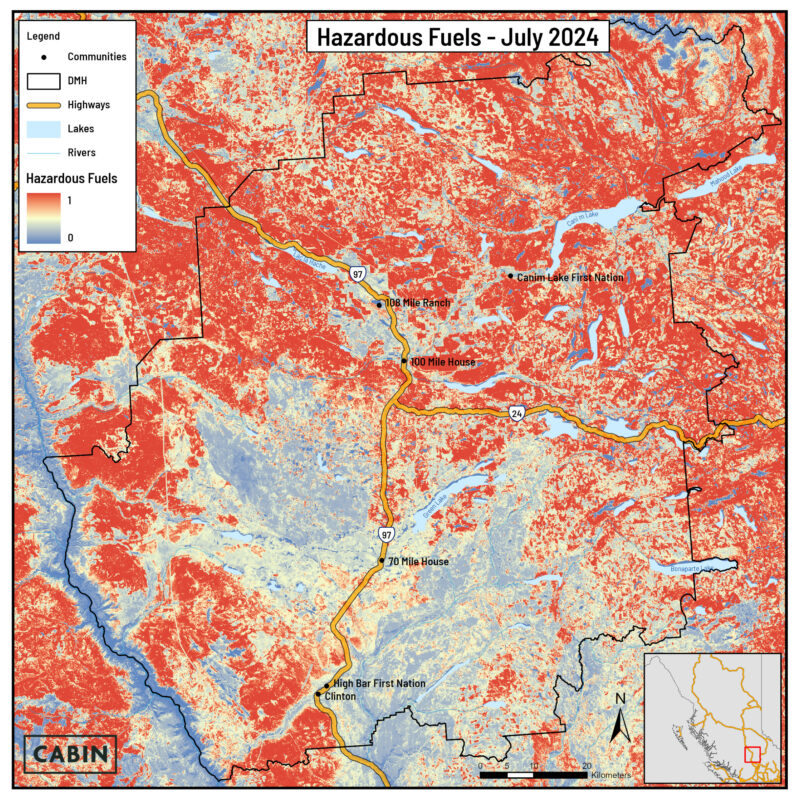 Figure 2: Custom hazardous fuels map for the 100 Mile region, developed using Sentinel-2 satellite imagery and machine learning classification.
Building on this hazardous fuels layer, we developed a fire exposure surface that estimates the likelihood a specific location will burn during a wildfire. Fire exposure (Beverly, McLoughlin, and Chapman 2021) combines both the chance that fire will reach a given site, including spotting effects up to 500 metres away, and the potential intensity of fire at that location based on surrounding fuels and topography. The spotting distance accounts for how embers can carry fire across barriers and ignite areas ahead of the main fire front. This output allows for a more detailed analysis of which areas face the highest threat and helps identify where fire poses the greatest risk to nearby values.
In addition to the fire exposure surface, we generated directional vulnerability transects (Beverly and Forbes 2023) to evaluate how fires are most likely to approach key areas, including communities, infrastructure, and important ecological sites. These transects illustrate the primary directions of fire spread toward values at risk, based on terrain, prevailing wind patterns, and fuel conditions (see Figure 3). This information supports more informed decisions on where to focus mitigation efforts, such as fuel break placement or targeted field verification.
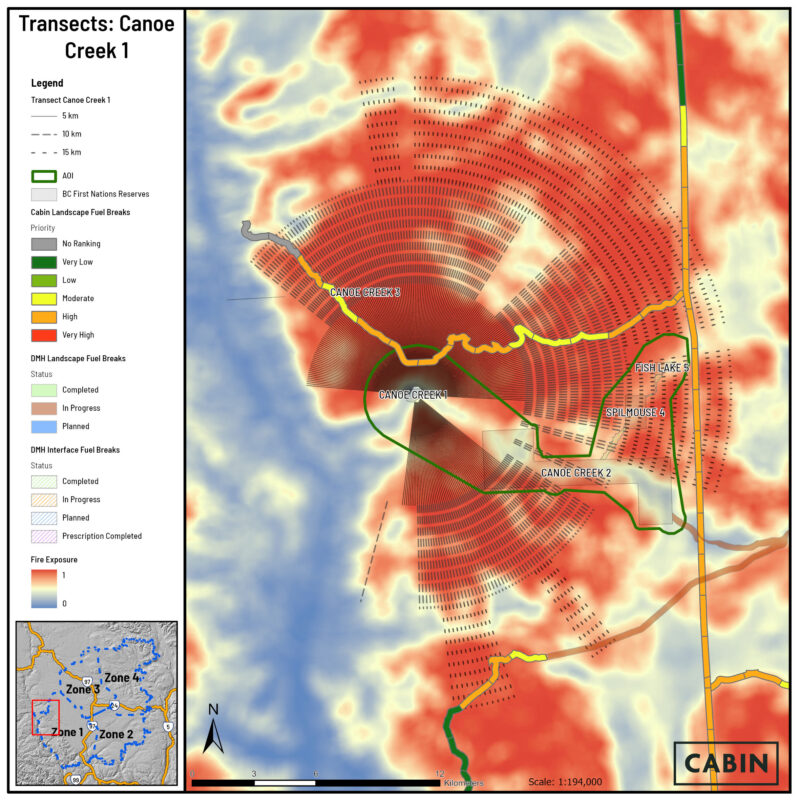
Figure 3: Fire exposure and directional vulnerability derived from fine-scale hazardous fuels mapping. The exposure surface highlights areas with the greatest likelihood and intensity of burning, while transects show the primary directions of fire spread toward key values, supporting targeted mitigation and field planning
Applications and Operational Value
Bringing together Burn Probability and fine-scale fuels mapping creates a rich set of outputs that directly support wildfire mitigation planning. One of the most immediate applications is the design of strategic fuel breaks. These are not just lines on a map, they are developed through an integrated process that accounts for local fuel conditions, modelled fire exposure, access, structure density, and community priorities. The prioritization process blends quantitative modeling with local knowledge, ensuring that the outcomes are both analytically robust, repeatable, and contextually appropriate.
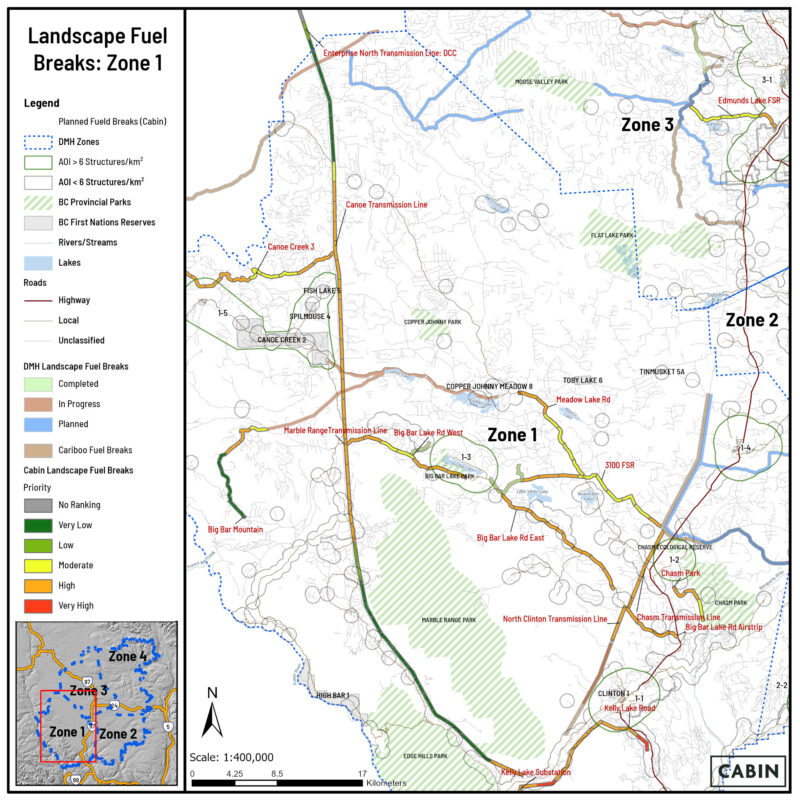
Figure 4: Prioritized landscape fuel breaks developed using enhanced wildfire modeling outputs and local knowledge. These features are strategically located to disrupt fire spread and protect key values across the 100 Mile region.
This modeling framework also plays a critical role in guiding fieldwork. Fireshed overlays and high-hazard zones point to specific locations where field crews and UAV operators can focus their efforts, improving the efficiency and relevance of on-the-ground data collection. These insights are directly useful for tactical planning, helping to determine where and how treatments should be laid out, verified, and maintained over time.
The Enhanced Wildfire Modeling approach is designed to be repeatable and scalable. While the focus here is on 100 Mile House, the same structure can be applied to other districts, community forests, or fire zones across the province.
References
Beverly, Jennifer L., and Air M. Forbes. 2023. “Assessing Directional Vulnerability to Wildfire.” Natural Hazards 117(1):831–49. doi:10.1007/s11069-023-05885-3.
Beverly, Jennifer L., Neal McLoughlin, and Elizabeth Chapman. 2021. “A Simple Metric of Landscape Fire Exposure.” Landscape Ecology 36(3):785–801. doi:10.1007/s10980-020-01173-8.
Parisien, Marc-André, Denyse A. Dawe, Carol Miller, Christopher A. Stockdale, and O. Bradley Armitage. 2019. “Applications of Simulation-Based Burn Probability Modelling: A Review.” International Journal of Wildland Fire 28(12):913. doi:10.1071/WF19069.
Recent Comments